Q & A: The Historical Volatility of VQT
Questions from readers are where I get to learn which aspects of volatility cause the most confusion and consternation among investors, so one of the things I will strive to do in 2012 is take more of the Q&A exchanges that might be buried in the comments sections of previous posts and shine some light on them here.
I was reminded of the importance of Q&A when I stumbled upon the following comment to VIX Exchange-Traded Products: The Year in Review, 2011, which I fear may have been lost in the holiday shuffle. [For the record, I tagged that post with my elusive “hall of fame” label, which I typically use to honor only handful of posts each year.]
The comment/question was posted as follows:
Thank you for alerting me to VQT. Where does one find the realized volatility number on it...or is this number just the VIX?
Before I dive into the issue of the realized or historical volatility (the two terms are synonymous) of VQT, I would be remiss in not pointing out that the question suggests some confusion between realized volatility and the VIX.
First things first, realized volatility is also known as historical volatility because it is based on past price moves, has already been observed, and can be calculated with great precision (see Calculating Centered and Non-Centered Historical Volatility for more details.) This is essentially what an investor sees out his or her rear view mirror.
Implied volatility is a very different animal from its realized/historical cousin. It boils down to the market’s best guess as to what (historical) volatility will look like in the future, based on how much investors are currently paying for options. The VIX is a specific instance of implied volatility and is based on options on the S&P 500 index over the course of the next 30 days. To return to the car analogy, it is what the consensus of drivers believe will be around the next bend and over the horizon.
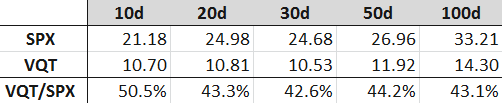
Getting back to VQT, the chart below captures historical volatility based on past daily price moves in VQT for lookback periods of 10 days, 20 days, 30 days, 50 days and 100 days. As these are calculated based on price moves, they are necessarily based on trading days, not calendar days, which are the unit of time used for implied volatility data.
Looking at the table, these historical volatility numbers for VQT are in 10.50 - 10.90 range for the past 30 trading days. The 100-day lookback window takes us back to early August, so it is not surprising that 100-day historical volatility is higher at 14.30.
I have also included some historical volatility data for the S&P 500 index (SPX) for comparison purposes. Note that historical volatility for the SPX has been 100 – 130% higher than it has been for VQT during the same lookback periods.
One can find historical volatility data on sites from brokers that specialize in options (optionsXpress, TradeMonster, Trade King, thinkorswim/TD Ameritrade, etc.) or from options data providers such as Livevol and iVolatility.
Related posts:
- Ten Things Everyone Should Know About the VIX
- What Is Historical Volatility?
- Calculating Centered and Non-Centered Historical Volatility
- Thinking About Volatility (First in a Series)
- Implied Volatility and Magnitude vs. Direction
- VIX Exchange-Traded Products: The Year in Review, 2011
- The Case for VQT
- Barclays VEQTOR ETN (VQT) Begins Trading
- Slicing and Dicing All 31 Flavors of the VIX ETPs
Disclosure(s):

