Chart of the Week: VXX vs. VIX
Given that I have been banging the drum about VXX (iPath S&P 500 VIX Short-Term Futures ETN) since the day it was launched, now that volatility is showing some signs of coming back to life and VXX regularly trades 10-20 million shares per day, I thought it would be appropriate to provide a comparison of the performance of VXX and VIX.
For anyone who has been following this space, the substance of this week’s chart of the week should come as no surprise. Sure, volatility has been falling with almost unprecedented regularity over the course of the last 14 months, but VXX has been falling at a much faster rate than the VIX. In the last year, VXX has fallen at about twice the rate of the VIX, with the difference between the two accelerating over the course of the last 6-9 months.
As has been noted on a number of instances here, the main culprits responsible for the underperformance of VXX are the term structure of VIX futures, contango and negative roll yield.
For those who wish to get a quick overview of some of the issues behind VXX calculations and performance, Why the VXX is Not a Good Short-Term or Long-Term Play is a good place to start, with VXX Calculations, VIX Futures and Time Decay offering a more detailed explanation of what is driving the gap in performance between VXX and the VIX. An even more thorough discussion of VXX can be found in The VIX ETNs: VXX and VXZ, in the March 2010 issue of Expiring Monthly.
For more on related subjects, readers are encouraged to check out:
- Chart of the Week: VXX Celebrates One Year of Futility
- Why the VXX Is Not a Good Short-Term or Long-Term Play
- VXX Calculations, VIX Futures and Time Decay
- Disappointment Lurks as Volume Surges in VXX
- Lost in Translation: VXX and VXZ
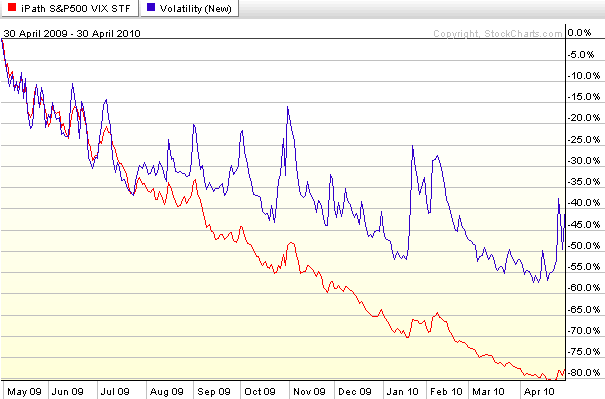
[source: StockCharts.com]
Disclosure(s): short VXX at time of writing; I am one of the founders and owners of Expiring Monthly

